$4,095,000
 Calculate Payment
61 Lower 7 Ponds Rd Water Mill, NY 11976
Single Family
Residence
4
Beds
4
Baths
...
Bed/Bath
Sq. Ft.
Property Activity
Time on Site
days
Days on Market
Views
Saves
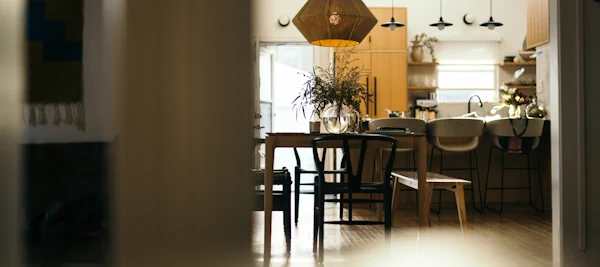
61 Lower Seven Ponds Road, a hidden gem in the heart of Water Mill where luxury living meets unspoiled natural beauty. Set on nearly 9 acres of lush, parklike grounds, this extraordinary estate offers a rare combination of serenity, space, and potential in one of the Hamptons' most sought-after encl...aves. The main residence blends timeless charm with endless opportunity. Currently featuring generous living areas, a luminous solarium that invites nature indoors, sunroom, den, and a sauna. The home also includes three unfinished rooms above the garage-offering the potential to expand the total living space to approximately 6,000 square feet. Whether you're dreaming of additional bedrooms, a gym, an artist's studio, or a home theater, the possibilities are as expansive as the landscape itself. Adding to the allure, an adorable, fully renovated guest cottage sits gracefully on the property. Ideal for hosting guests, or as a private workspace, the cottage complements the main home while offering its own stylish retreat. Outdoors, the estate is a true recreational paradise. Wide open lawns are framed by mature trees and landscaping, providing both seclusion and elegance. Nature lovers and sports enthusiasts alike will be captivated by the setting-whether it's boating, archery, fishing, or hunting, the property is tailored to a range of outdoor passions. In warmer months, enjoy bird watching by day and tranquil sunsets over the western-facing pond by evening. In the winter, the landscape transforms into your personal ice-skating haven. This exceptional Water Mill offering is more than just a residence-it's a lifestyle. Whether you're seeking a peaceful escape, a legacy compound, or a canvas to bring your architectural vision to life, 61 Lower Seven Ponds Road delivers the ultimate in Hamptons living. Architectural rendering shown is for illustrative purposes only, designed by Christopher Arelt, Architect, AIA. Nautilus Architects. Additional information about this design/ build opportunity available.
Continue reading
MLS#
L3586103
Property Type
Single Family
Bedrooms
4
Bathrooms
4 Full
Year Built
1898
Lot Size
8.76
Stories
2.0
Sewer
Holding Tank
Receive an email as soon as the price changes
Receive an email
as soon as the price changesGet Price Alerts
Don't miss your chance. Receive an email as soon as the price changes.
Get email alerts when
a home price changes
Sign up
Walk Score measures the walkability of any address, Transit Score measures access to public transit on a scale of 1-100.
Source: Walk Score®
How much home can I afford?
Kickstart your home search journey with our online Pre-Approval.
Nearby Homes For Sale
Just Listed
And
Homes Available
In
See How Much You Could Save
Thinking about buying or selling? Talk to one of our Mortgage Professionals today to see how much you could save on your next home. Call us at 833-981-2030.